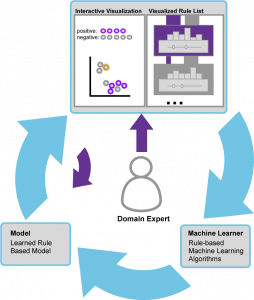
Interactive Rules in Analytics
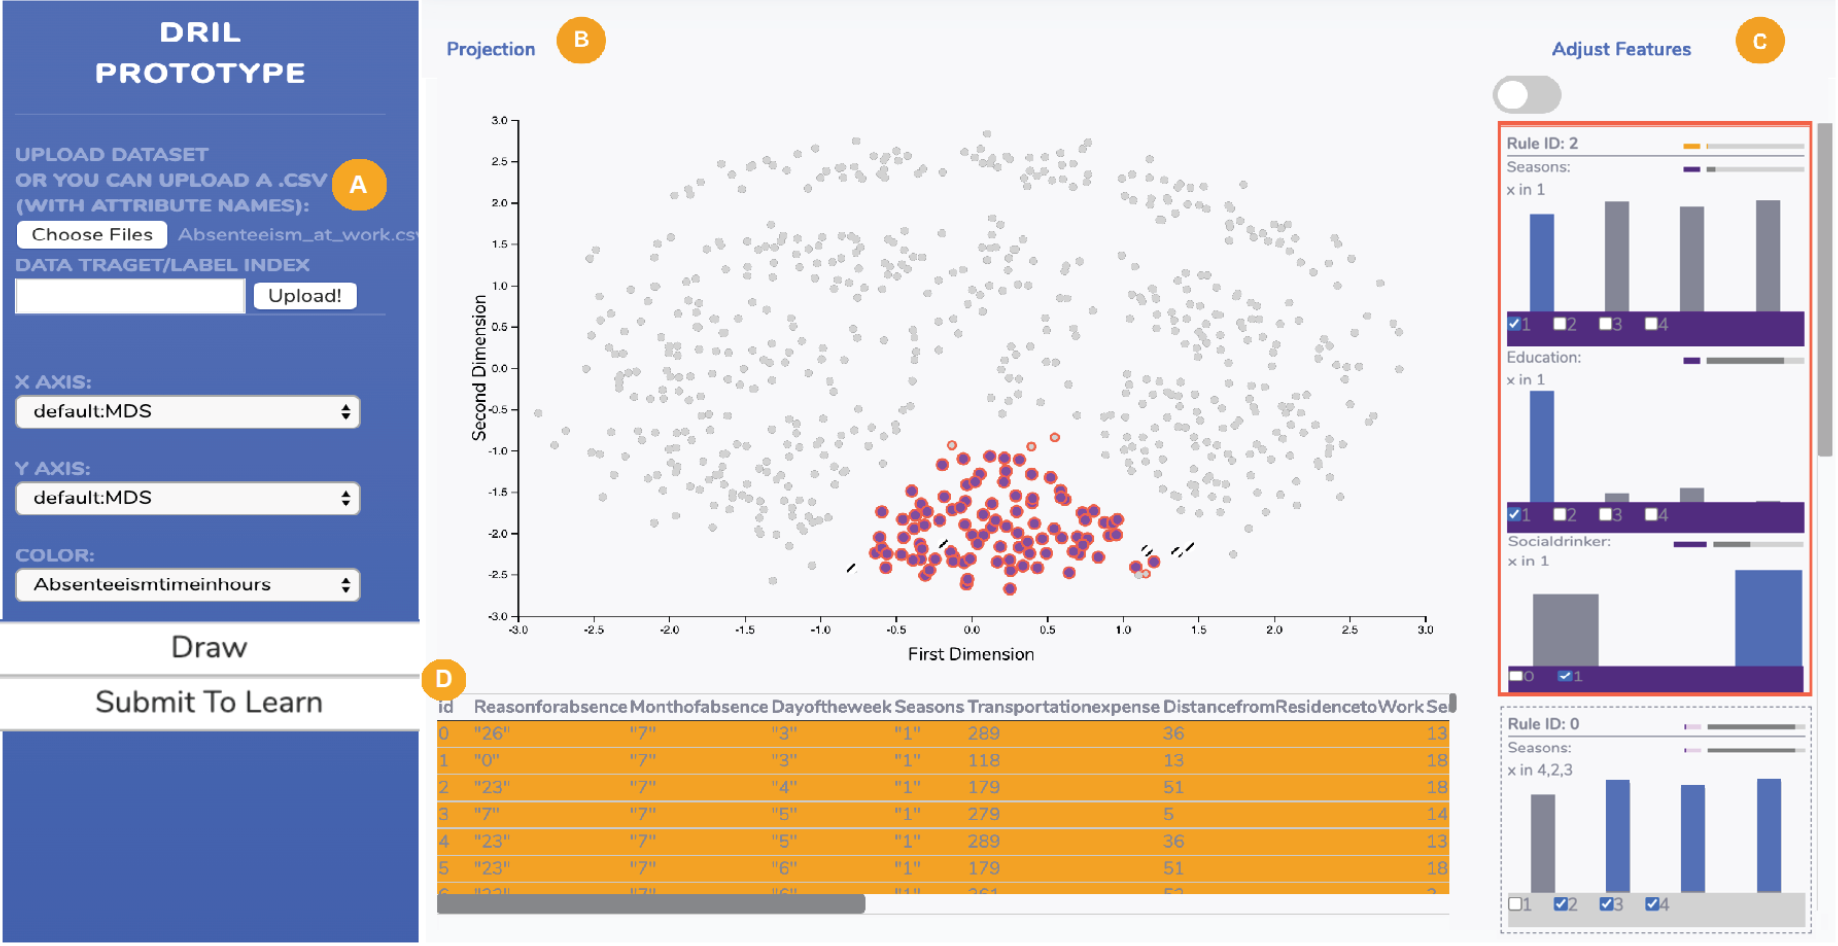
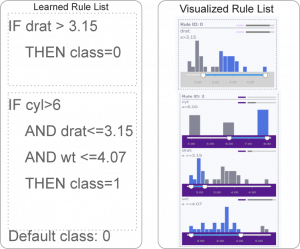
DRIL: Descriptive Rules through Interactive Learning
Analyzing data is increasingly a part of jobs across industry, science and government, but data stakeholders are not necessarily experts in analytics. The human-in-the-loop (HIL) approach includes semantic interaction tools, which leverage machine learning behind the scenes to assist users with their tasks without engaging them directly with algorithms. One widely applicable model for how humans under-stand data is descriptive rules, which can characterize important attributes and simultaneously their crucial values or ranges. In this paper, we introduce an approach to help with data understanding via interactively and automatically generated rules. Our approach makes discerning the behavior of groups of interesting data efficient and simple by bridging the gap between machine learning methods for rule learning and the user experience of sensemaking through visual exploration. We have evaluated our approach with machine learning experiments to confirm an existing rule learning algorithm performs well in this interactive context even with a small amount of user input, and created a prototype system, DRIL (Descriptive Rules by Interactive Learning), to demonstrate its capability through a case study.
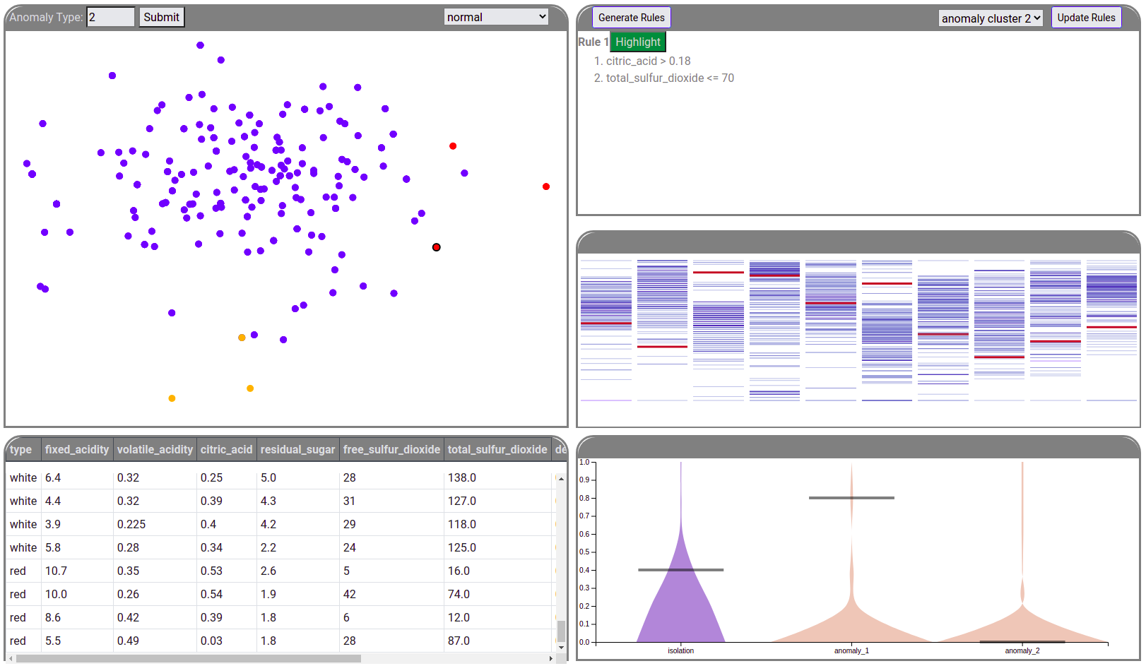
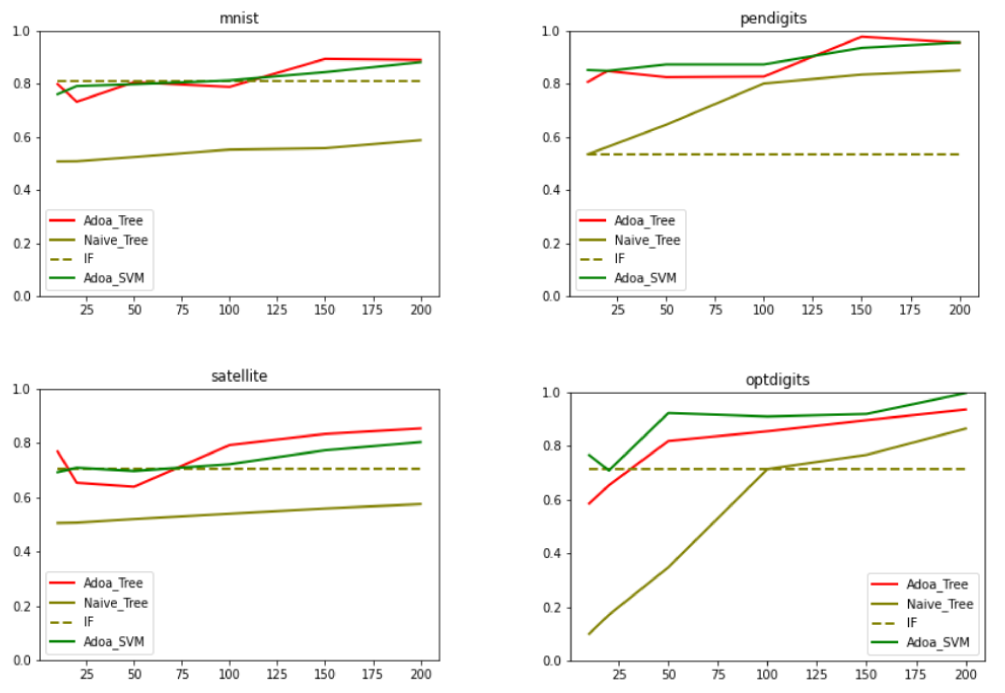
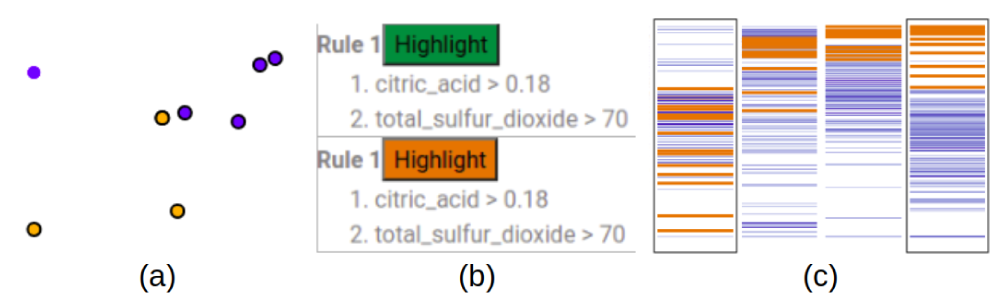
RISSAD: Rule-based Interactive Semi-Supervised Anomaly Detection
Anomaly detection has gained increasing attention from researchers in recent times. Owing to a lack of reliable ground-truth labels, many current state-of-art techniques focus on unsupervised learning, which lacks a mechanism for user involvement. Further, these techniques do not provide interpretable results in a way that is understandable to the general public. To address this problem, we present RISSAD: an interactive technique that not only helps users to detect anomalies, but automatically characterizes those anomalies with descriptive rules. The technique employs a semi-supervised learning approach based on an algorithm that relies on a partially-labeled dataset. Addressing the need for feedback and interpretability, the tool enables users to label anomalies individually or in groups, using visual tools. We demonstrate the tool's effectiveness using quantitative experiments simulated on existing anomaly-detection datasets, and a usage scenario that illustrates a real-world application.
Journalism
Biotechnology
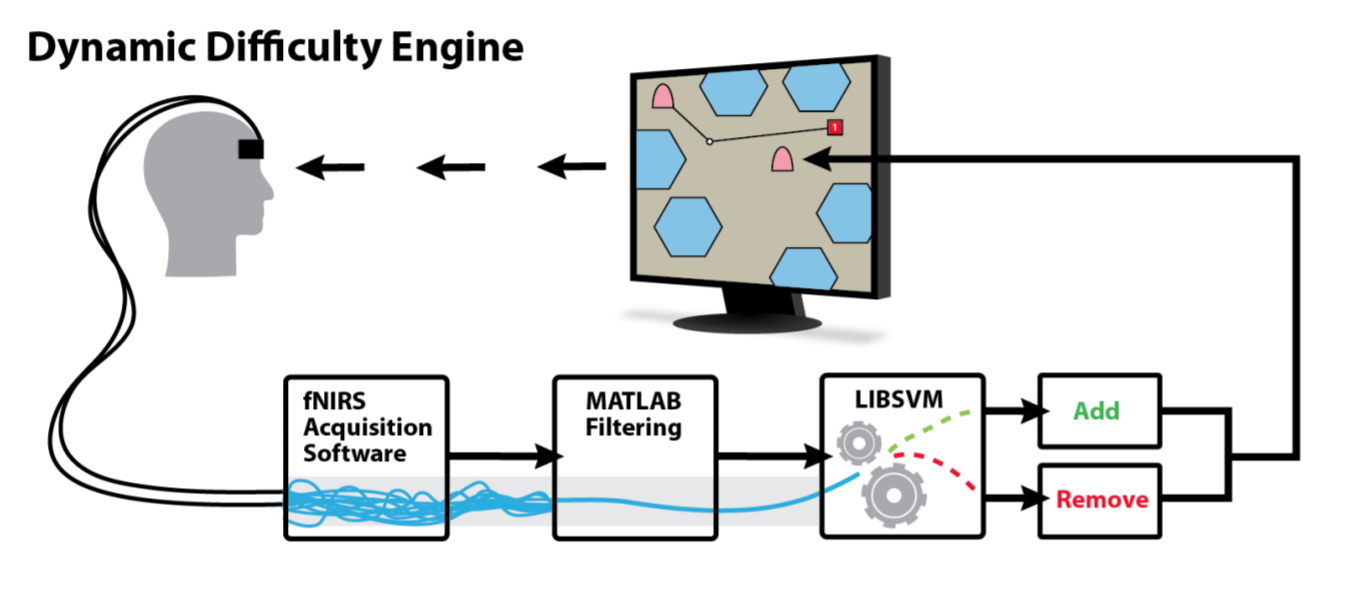
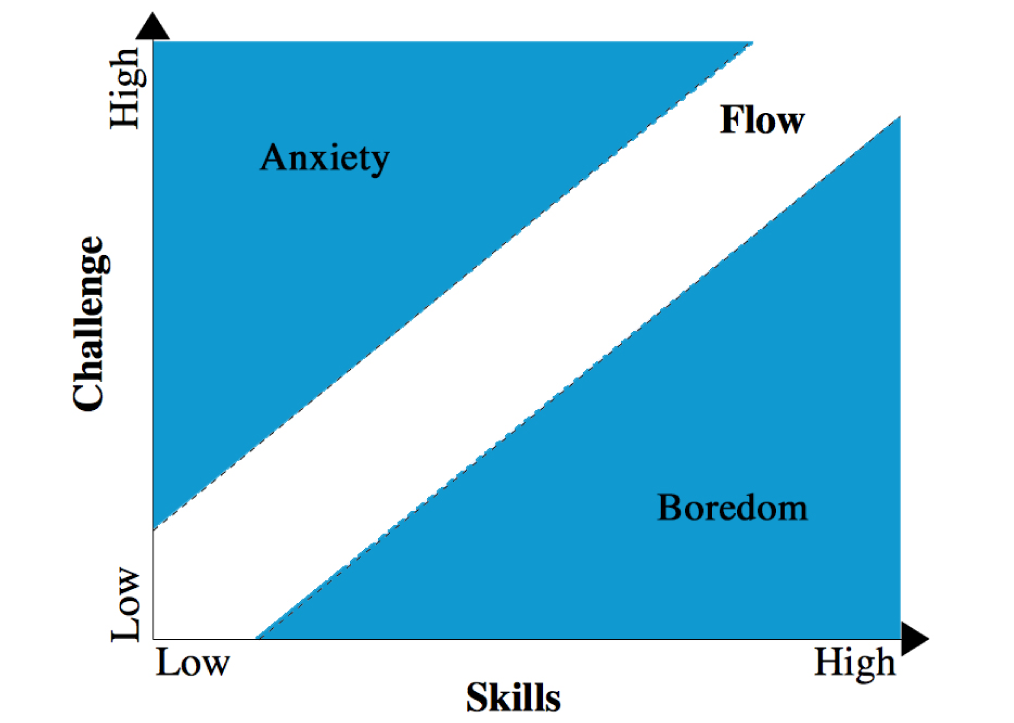
Dynamic Difficulty Using Brain Metrics of Workload
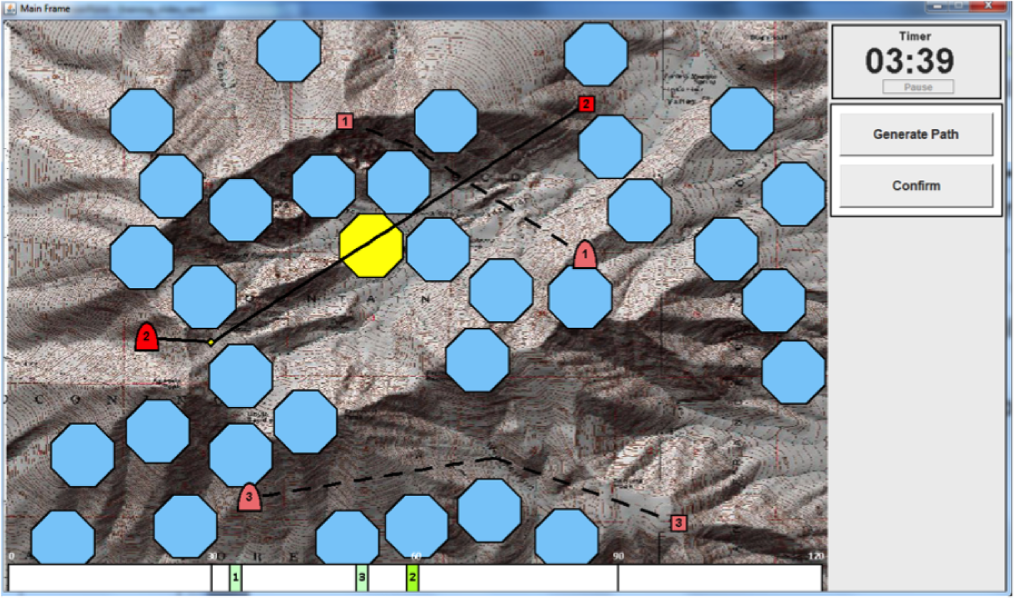
Dynamic difficulty adjustments can be used in human-computer systems in order to improve user engagement and performance. In this paper, we use functional near-infrared spectroscopy (fNIRS) to obtain passive brain sensing data and detect extended periods of boredom or overload. From these physiological signals, we can adapt a simulation in order to optimize workload in real-time, which allows the system to better fit the task to the user from moment to moment. To demonstrate this idea, we ran a laboratory study in which participants performed path planning for multiple unmanned aerial vehicles (UAVs) in a simulation. Based on their state, we varied the difficulty of the task by adding or removing UAVs and found that we were able to decrease error by 35% over a baseline condition. Our results show that we can use fNIRS brain sensing to detect task difficulty in real-time and construct an interface that improves user performance through dynamic difficulty adjustment.
Medical Informatics
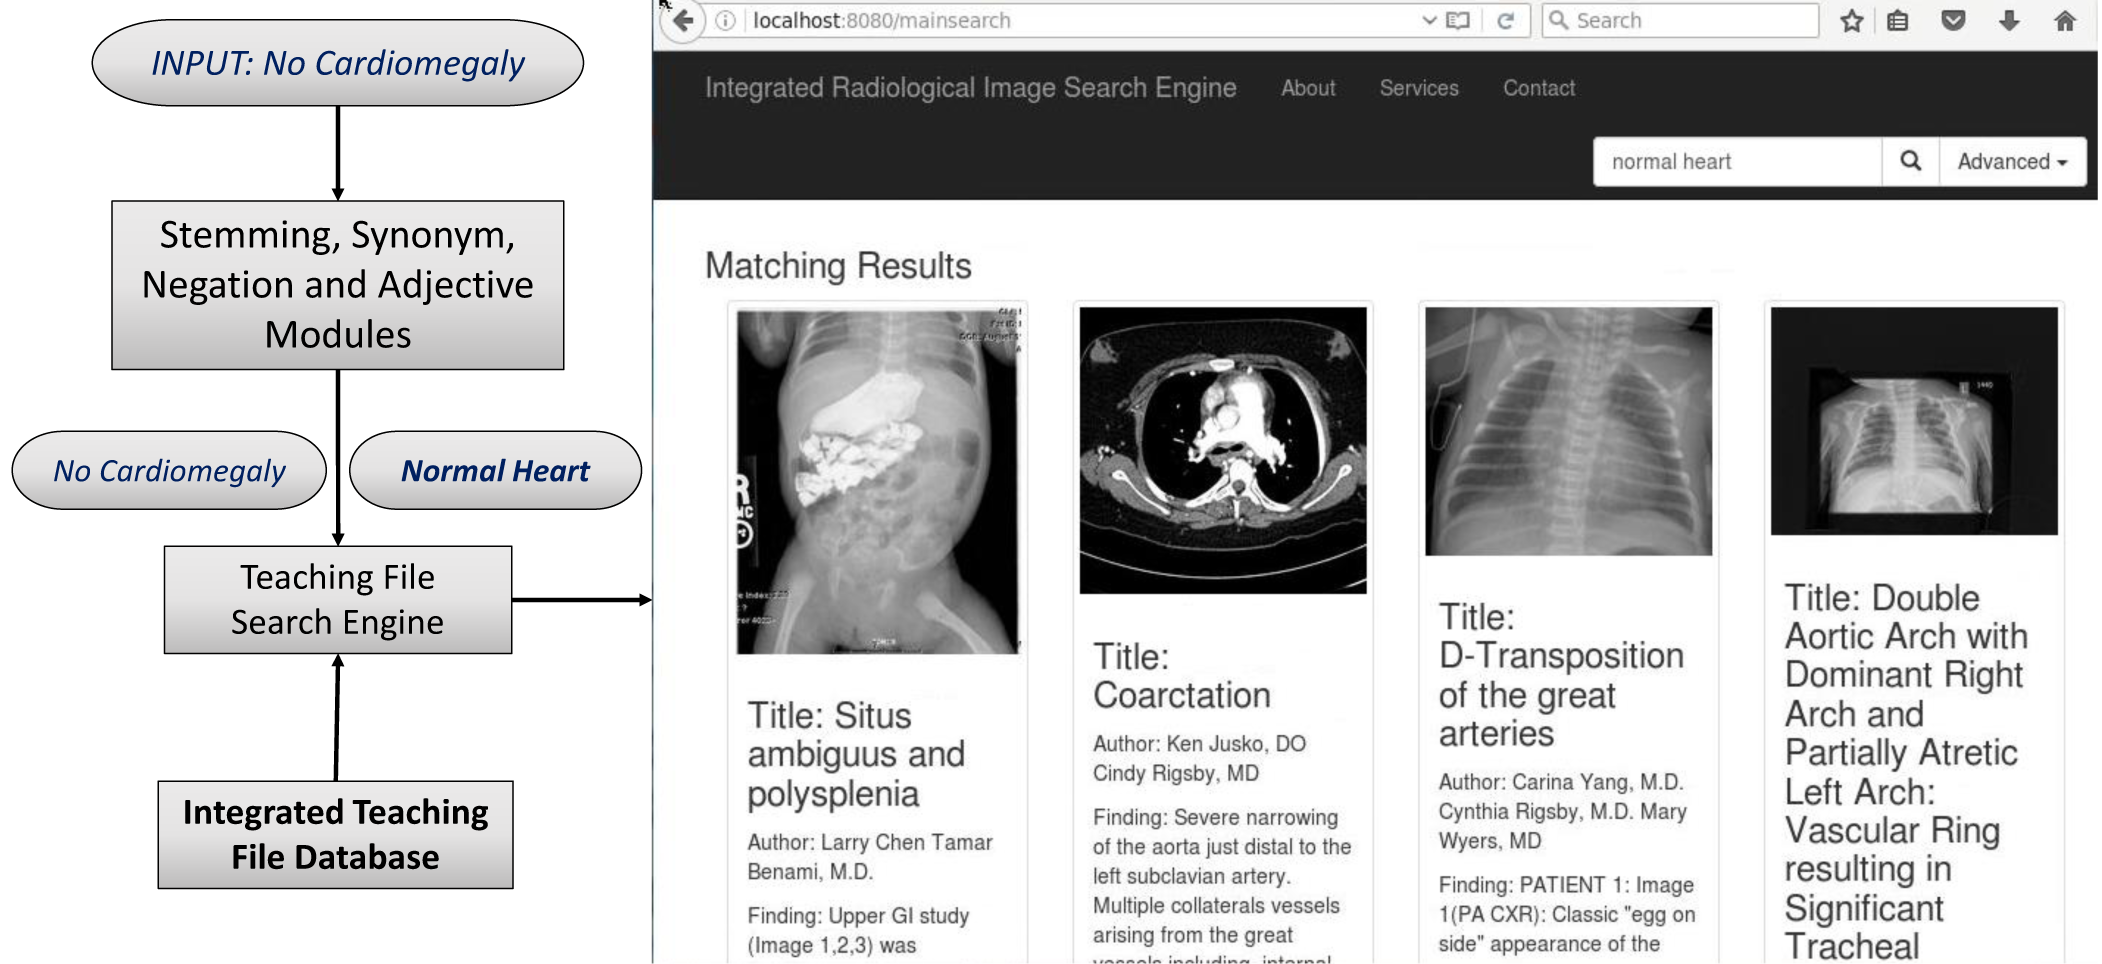
An Integrated Database and Smart Search Tool for Medical Knowledge Extraction from Radiology Teaching Files
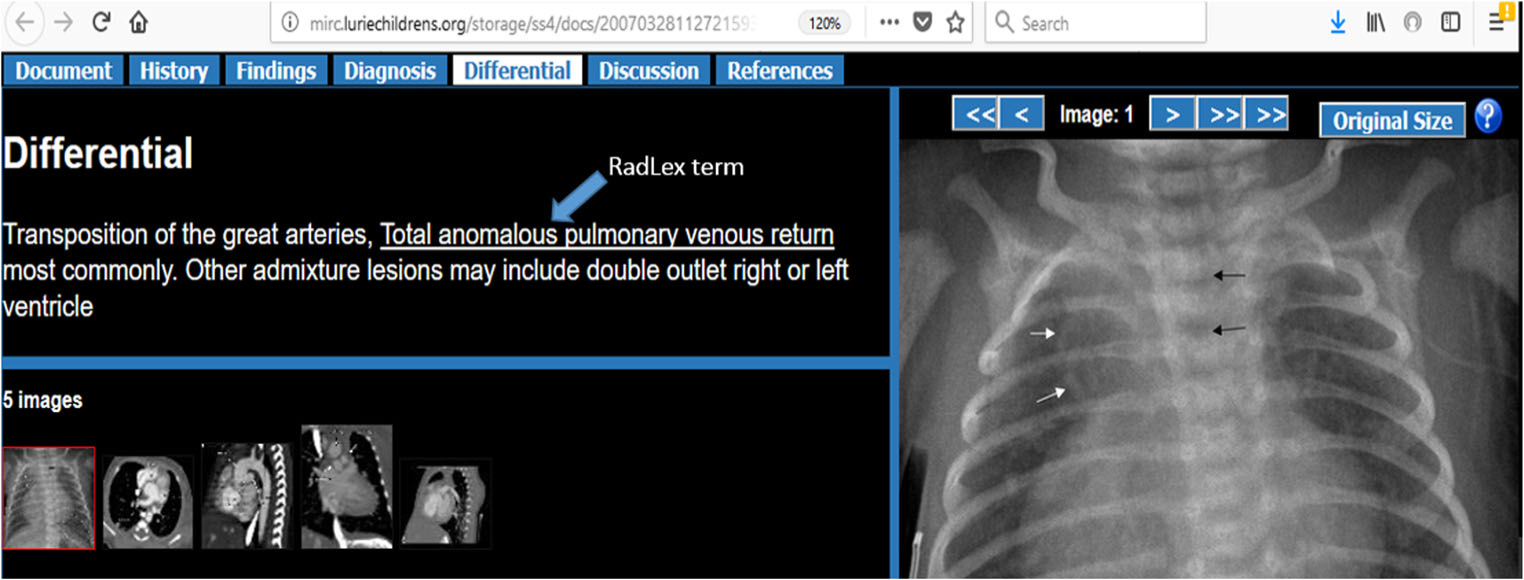
Accurate and timely diagnosis is crucial for an effective medical treatment. Teaching les are widely used by radiologists as a resource in the diagnostic process and to teach students of radiology. Teaching les contain images, recorded discussion and notes, external references, augmenting annotations, and patient history. Most hospitals maintain an active collection of teaching les for their internal purposes, but many publically available teaching les are available through online sources that typically provide a basic keyword search interface but little else that can help physicians and the most relevant examples. Other secondary sources (e.g., journals or radiology textbooks) might also be referenced from a teaching file or provide an independent source of information; however, journal and textbook search capabilities, if available, can be very ad hoc and even more limited than for public teaching le repositories. Therefore, in order to access multiple resources, radiologists need to
manually navigate each particular source and aggregate the search results into a full answer.
Ontology-Based Radiology Teaching File Summarization, Coverage, and Integration
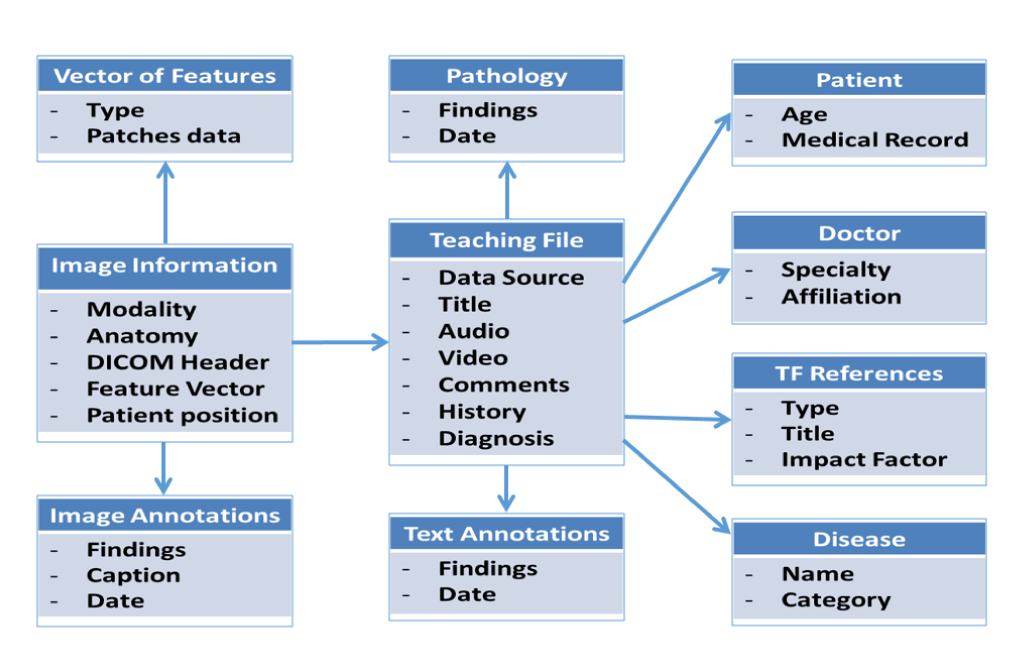
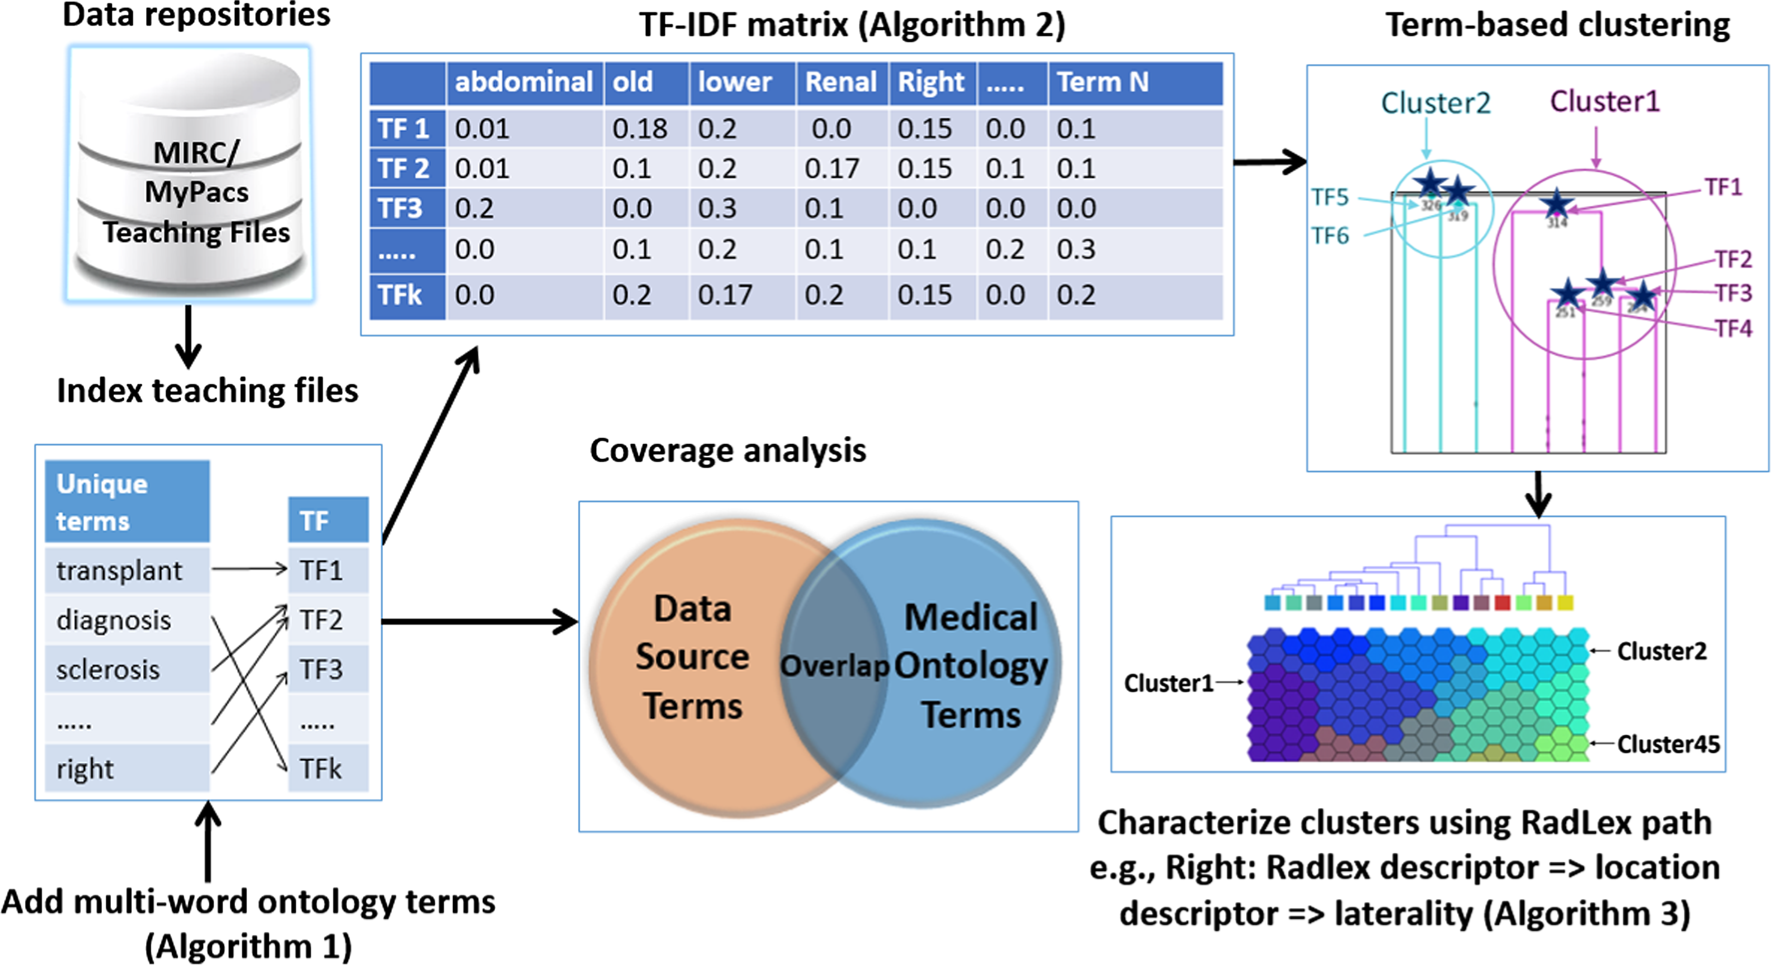
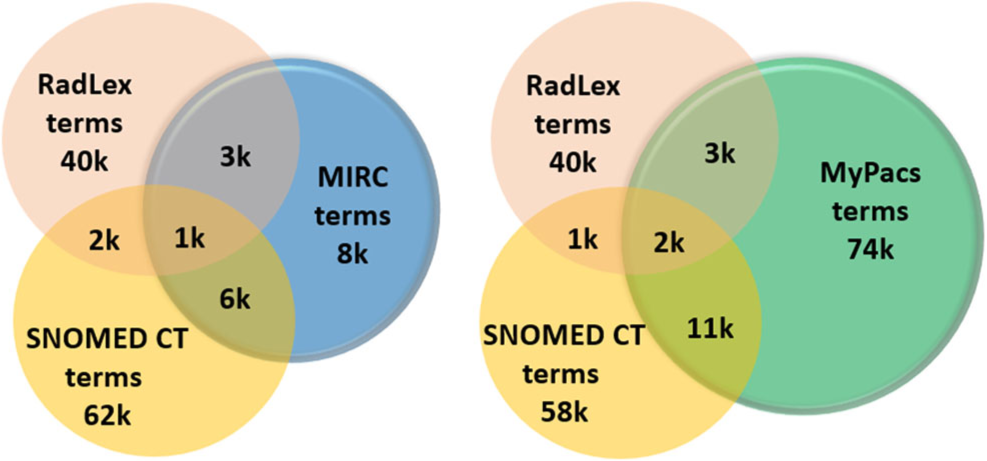
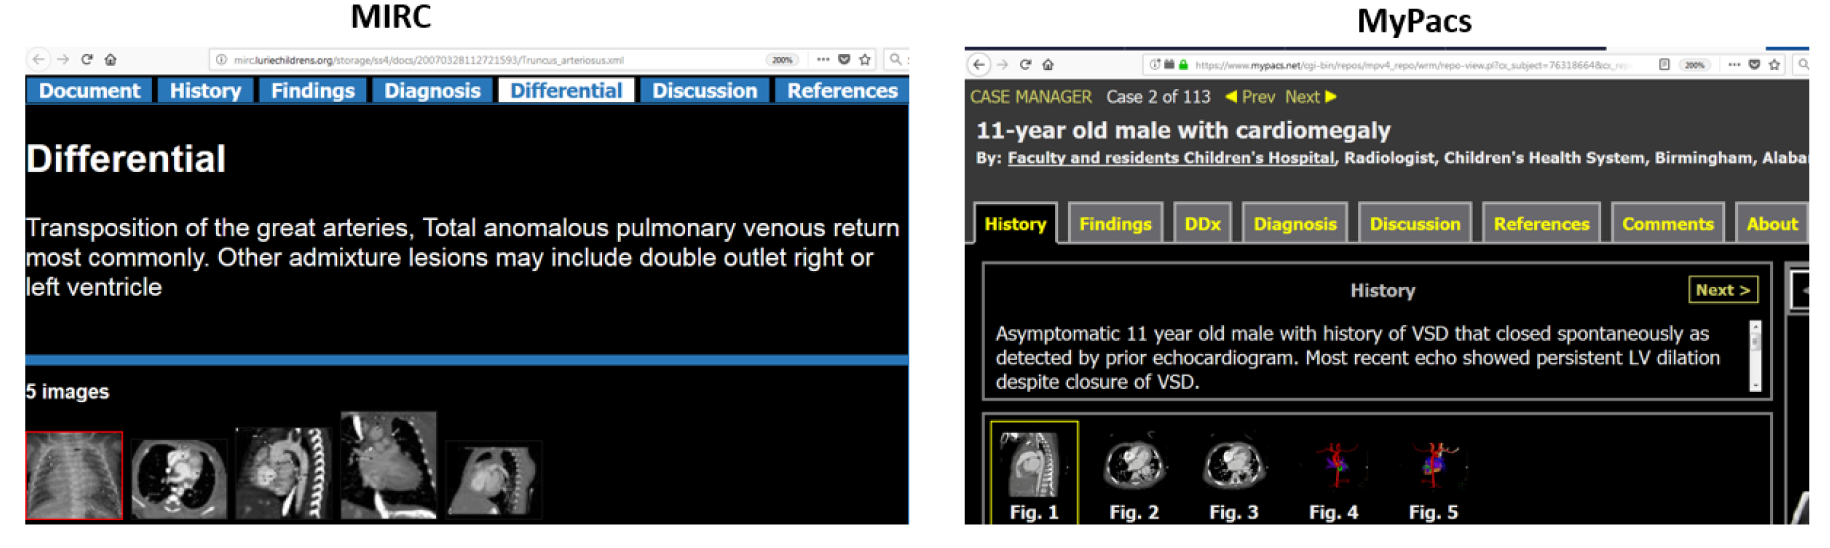
Radiology teaching file repositories contain a large amount of information about patient health and radiologist interpretation of medical findings. Although valuable for radiology education, the use of teaching file repositories has been hindered by the ability to perform advanced searches on these repositories given the unstructured format of the data and the sparseness of the different repositories. Our term coverage analysis of two major medical ontologies, Radiology Lexicon (RadLex) and Unified Medical Language System (UMLS) Systematized Nomenclature of Medicine Clinical Terms (SNOMED CT), and two teaching file repositories, Medical Imaging Resource Community (MIRC) and MyPacs, showed that both ontologies combined cover 56.3% of terms in the MIRC and only 17.9% of terms in MyPacs. Furthermore, the overlap between the two ontologies (i.e., terms included by both the RadLex and UMLS SNOMED CT) was a mere 5.6% for the MIRC and 2% for the RadLex. Clustering the content of the teaching file repositories showed that they focus on different diagnostic areas within radiology. The MIRC teaching file covers mostly pediatric cases; a few cases are female patients with heart-, chest-, and bone-related diseases. The MyPacs contains a range of different diseases with no focus on a particular disease category, gender, or age group. MyPacs also provides a wide variety of cases related to the neck, face, heart, chest, and breast. These findings provide valuable insights on what new cases should be added or how existent cases may be integrated to provide more comprehensive data repositories. Similarly, the low-term coverage by the ontologies shows the need to expand ontologies with new terminology such as new terms learned from these teaching file repositories and validated by experts. While our methodology to organize and index data using clustering approaches and medical ontologies is applied to teaching file repositories, it can be applied to any other medical clinical data.
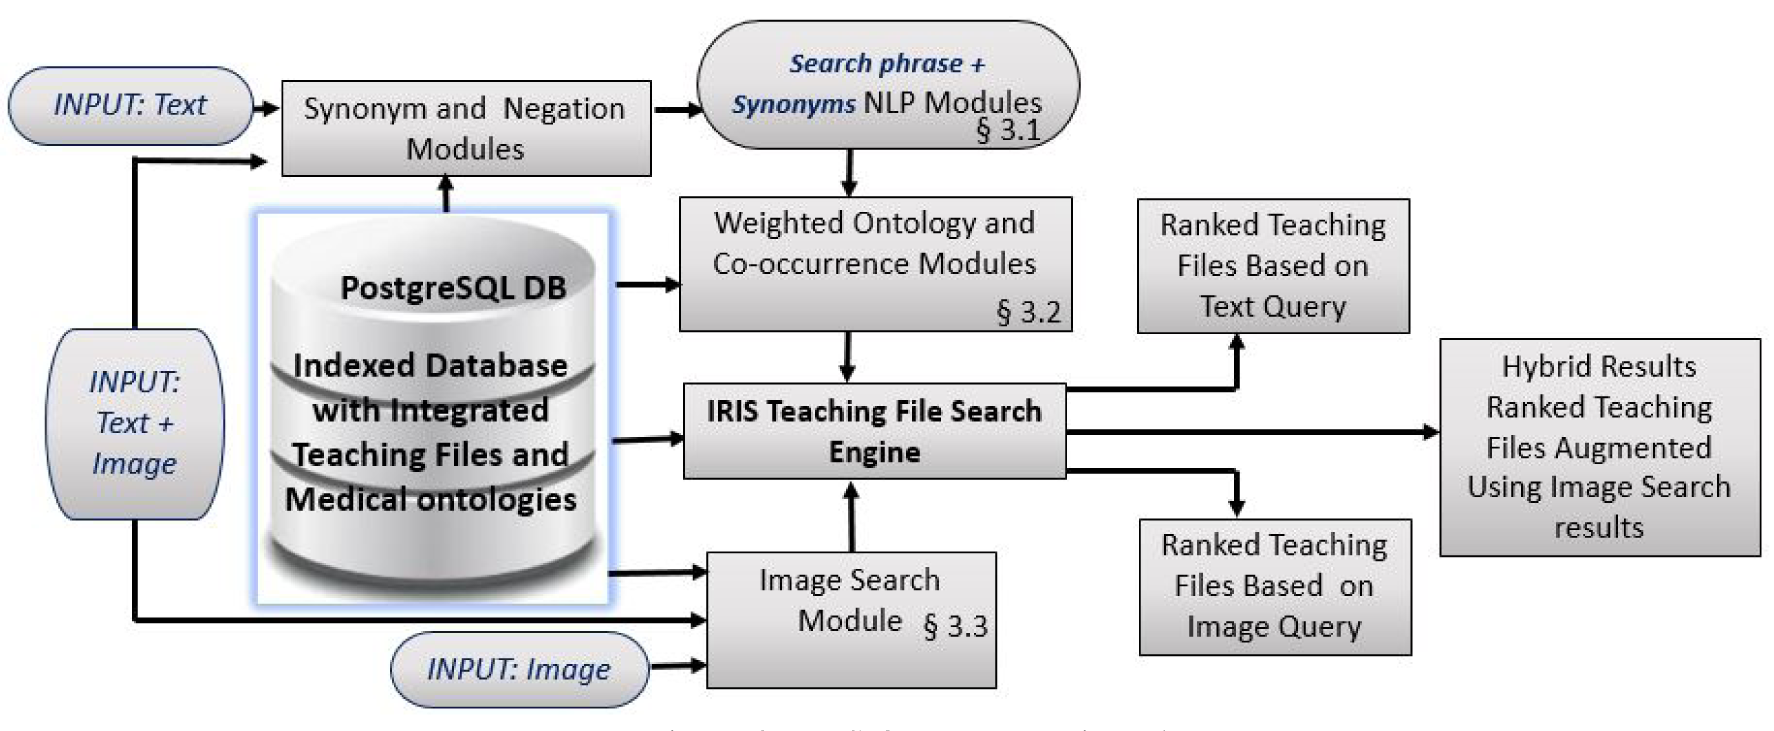
Multimodal Ranked Search over Integrated Repository of Radiology Data Sources
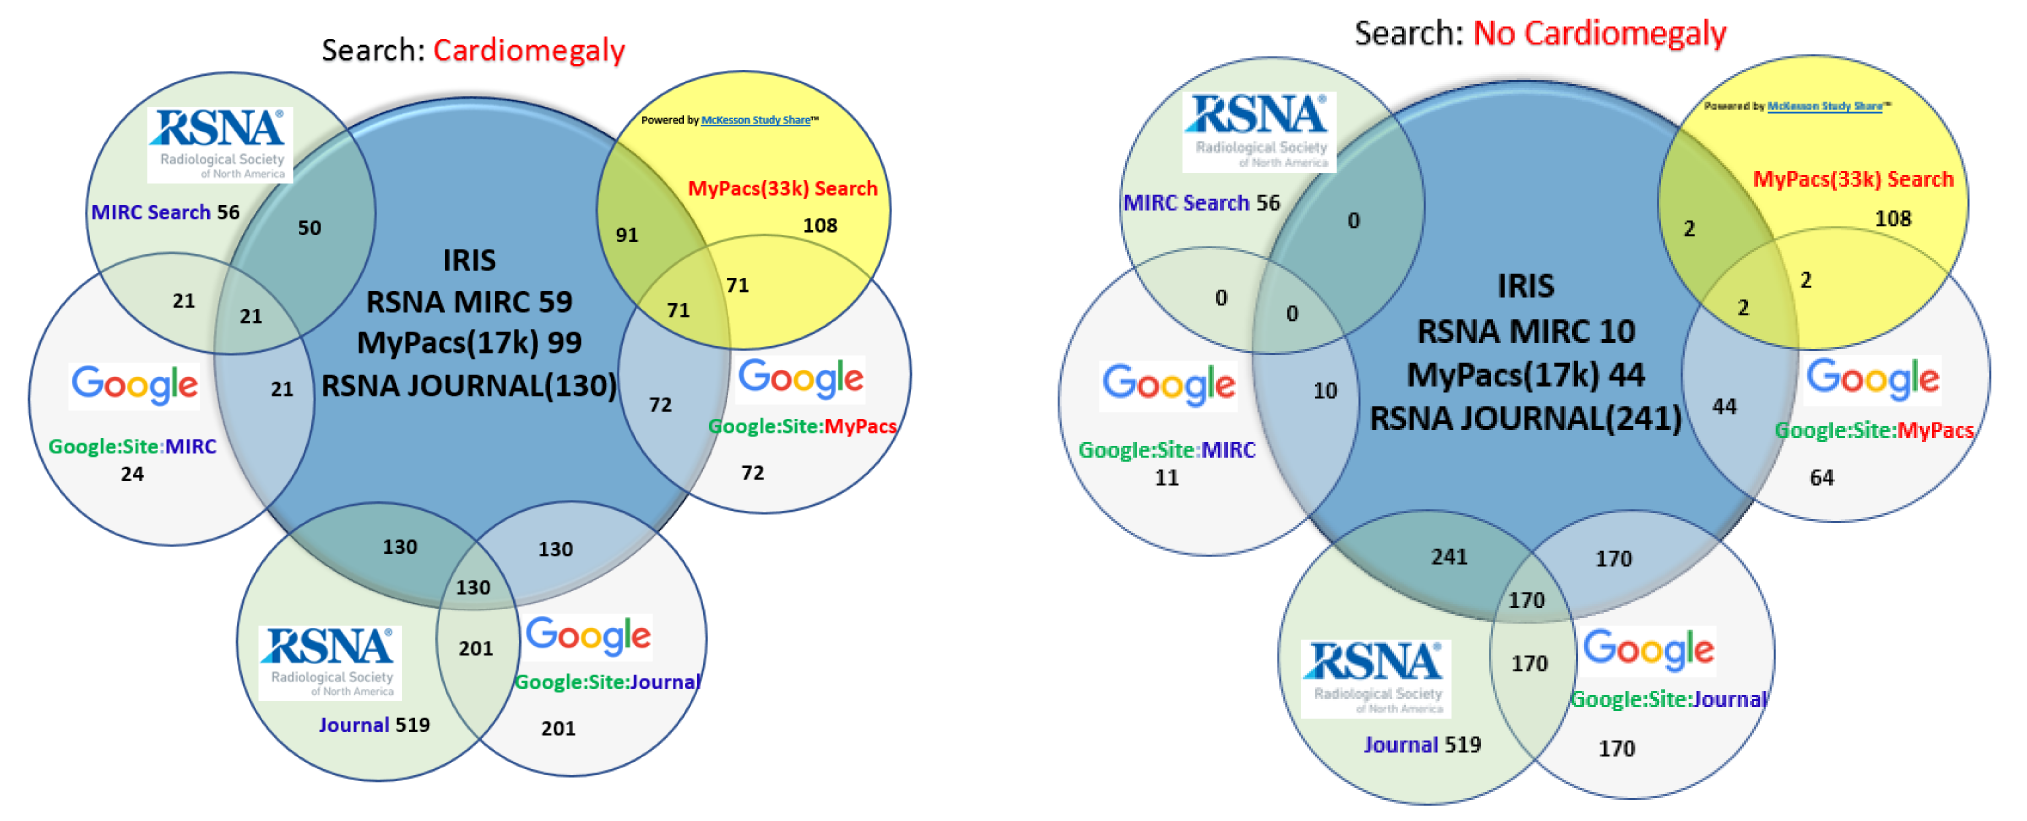
Radiology teaching files serve as a reference in the diagnosis process and as a learning resource for radiology residents. Many public teaching file data sources are available online and private in-house repositories are maintained in most hospitals. However, the native interfaces for querying public repositories have limited capabilities. The Integrated Radiology Image Search (IRIS) Engine was designed to combine public data sources and in-house teaching files into a single resource. In this paper, we present and evaluate ranking strategies that prioritize the most relevant teaching files for a query. We quantify query context through a weighted text-based search and with ontology integration. We also incorporate an image-based search that allows finding visually similar teaching files. Finally, we augment text-based search results with image-based search – a hybrid approach that further improves search result relevance. We demonstrate that this novel approach to searching radiology data produces promising results by evaluating it with an expert panel of reviewers and by comparing our search performance against other publicly available search engines.
Collaborations in Visual Analytics
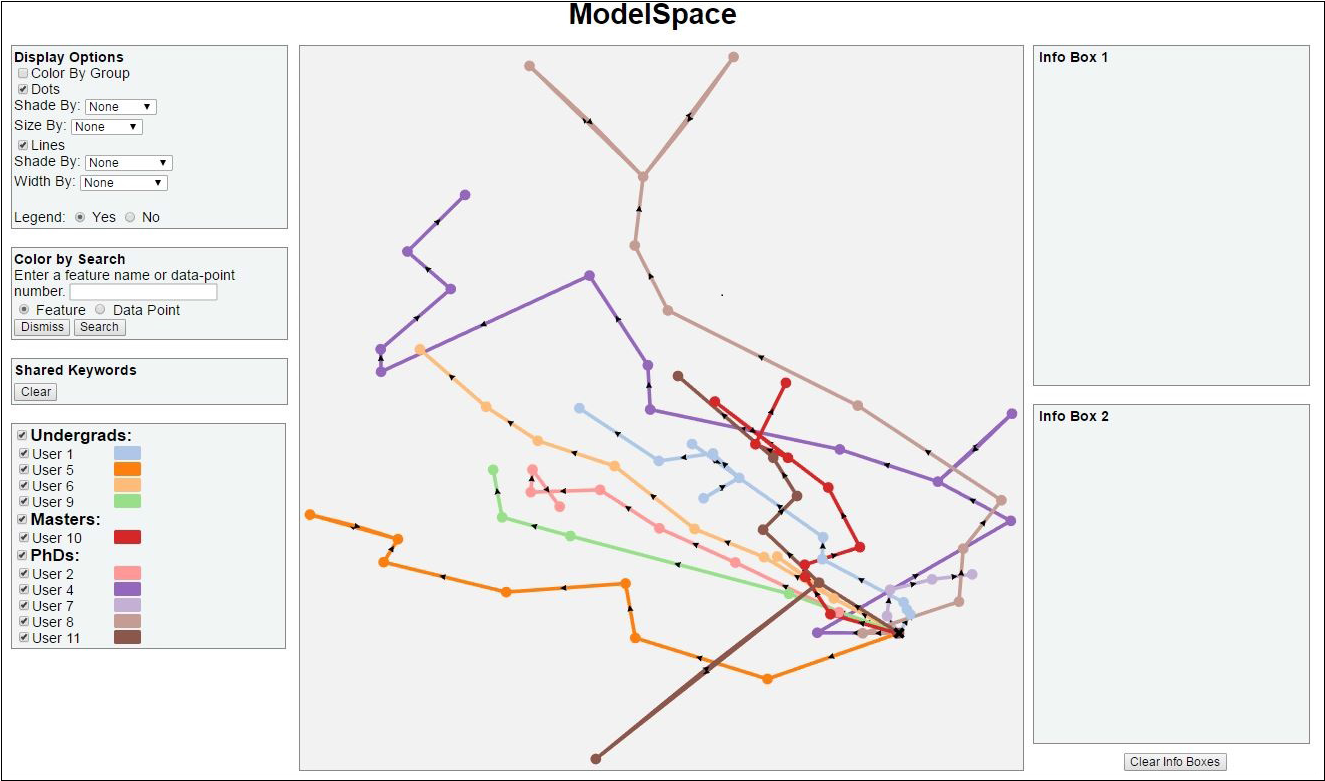
ModelSpace: Visualizing the Trails of Data Models in Visual Analytics Systems
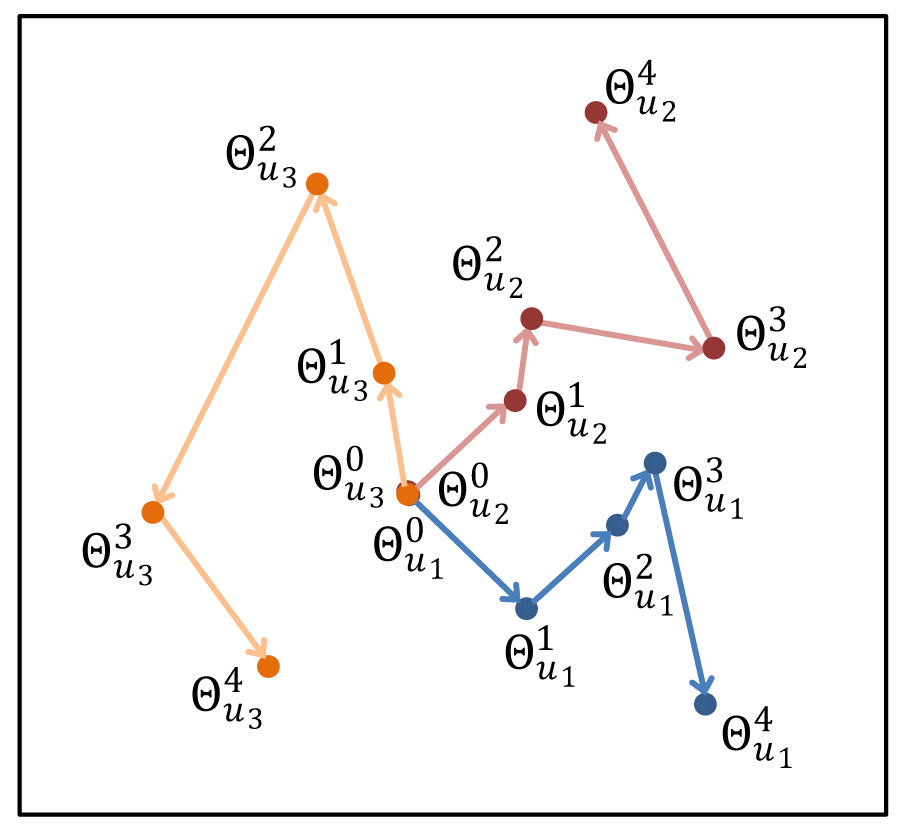
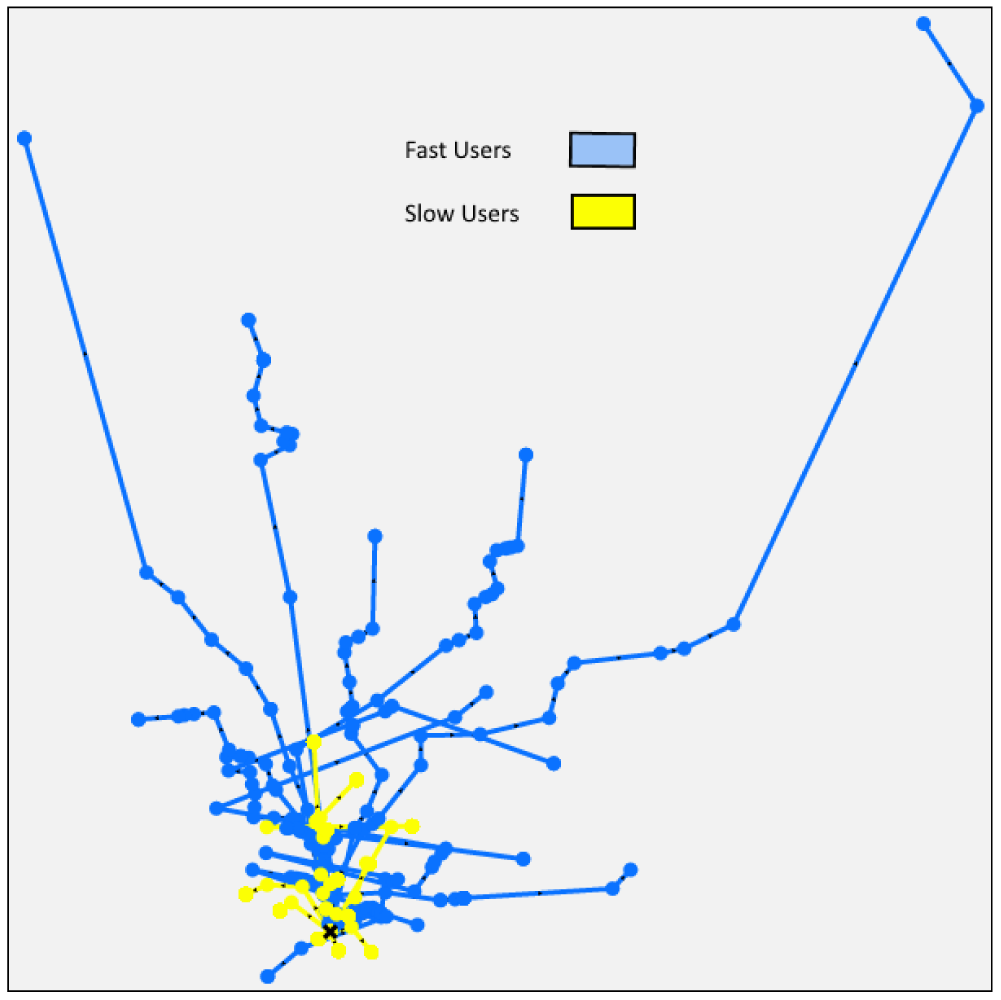
User interactions with visualization systems have been shown to encode a great deal of information about the the users’ thinking processes, and analyzing their interaction trails can teach us more about the users, their approach, and how they arrived at insights. This deeper understanding is critical to improving their experience and outcomes, and there are tools available to visualize logs of interactions. It can be difficult to determine the structurally interesting parts of interaction data, though, like what set of button clicks constitutes an action that matters. In the case of visual analytics systems that use machine learning models, there is a convenient marker of when the user has significantly altered the state of the system via interaction: when the model is updated based on new information. We present a method for numerical analytic provenance using high dimensional visualization to show and compare the trails of these sequences of model states of the system.
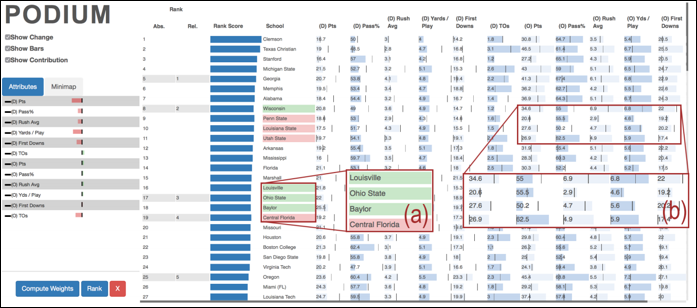
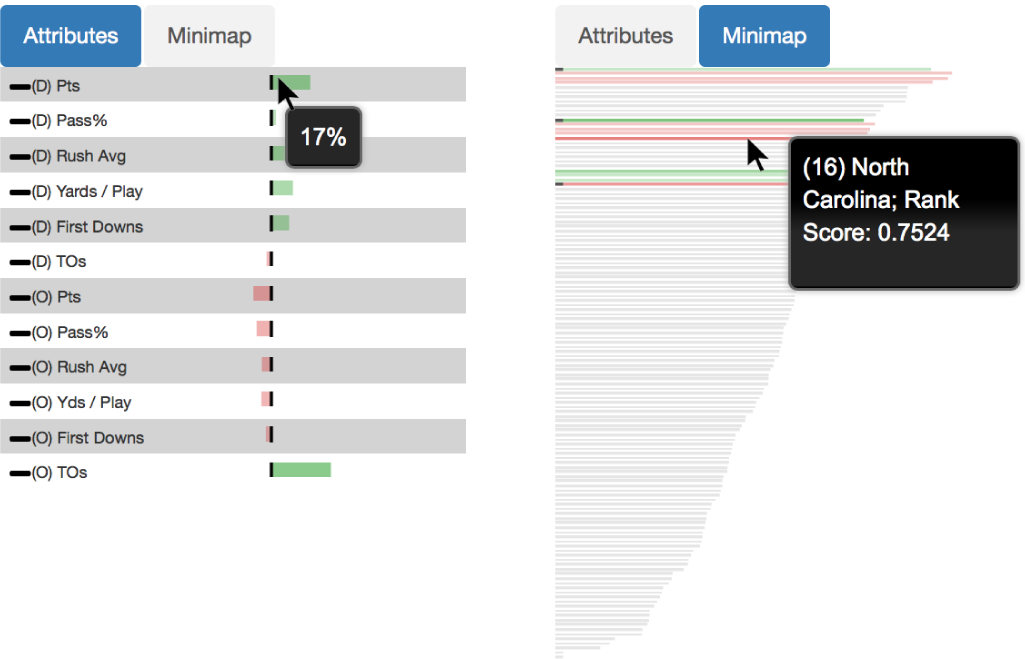
Podium: Ranking Data Using Mixed-Initiative Visual Analytics
People often rank and order data points as a vital part of making decisions. Multi-attribute ranking systems are a common tool used to make these data-driven decisions. Such systems often take the form of a table-based visualization in which users assign weights to the attributes representing the quantifiable importance of each attribute to a decision, which the system then uses to compute a ranking of the data. However, these systems assume that users are able to quantify their conceptual understanding of how important particular attributes are to a decision. This is not always easy or even possible for users to do. Rather, people often have a more holistic understanding of the data. They form opinions that data point A is better than data point B but do not necessarily know which attributes are important. To address these challenges, we present a visual analytic application to help people rank multi-variate data points. We developed a prototype system, Podium, that allows users to drag rows in the table to rank order data points based on their perception of the relative value of the data. Podium then infers a weighting model using Ranking SVM that satisfies the user's data preferences as closely as possible. Whereas past systems help users understand the relationships between data points based on changes to attribute weights, our approach helps users to understand the attributes that might inform their understanding of the data. We present two usage scenarios to describe some of the potential uses of our proposed technique: (1) understanding which attributes contribute to a user's subjective preferences for data, and (2) deconstructing attributes of importance for existing rankings. Our proposed approach makes powerful machine learning techniques more usable to those who may not have expertise in these areas.
Toolkits and Frameworks
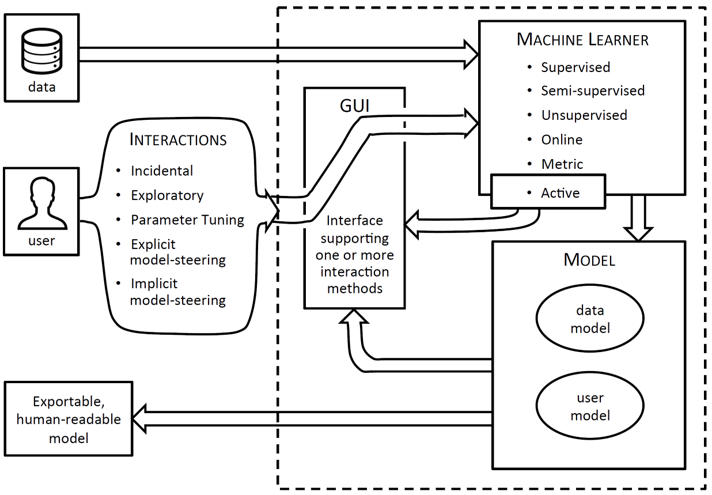
Human-Machine-Learner Interaction: The Best of Both Worlds
This position statement presents a notional framework for more tightly integrating interactive visual systems with machine learning. We posit that increasingly, powerful systems will be built for data analysis and consumer use that leverage the best of both human insight and raw computing power by effectively integrating machine learning and human interaction. We note some existing contributions to this space and provide a framework that organizes existing efforts and illuminates future endeavors by suggesting the categories of machine learning algorithm and interaction type that are most germane to this integration.